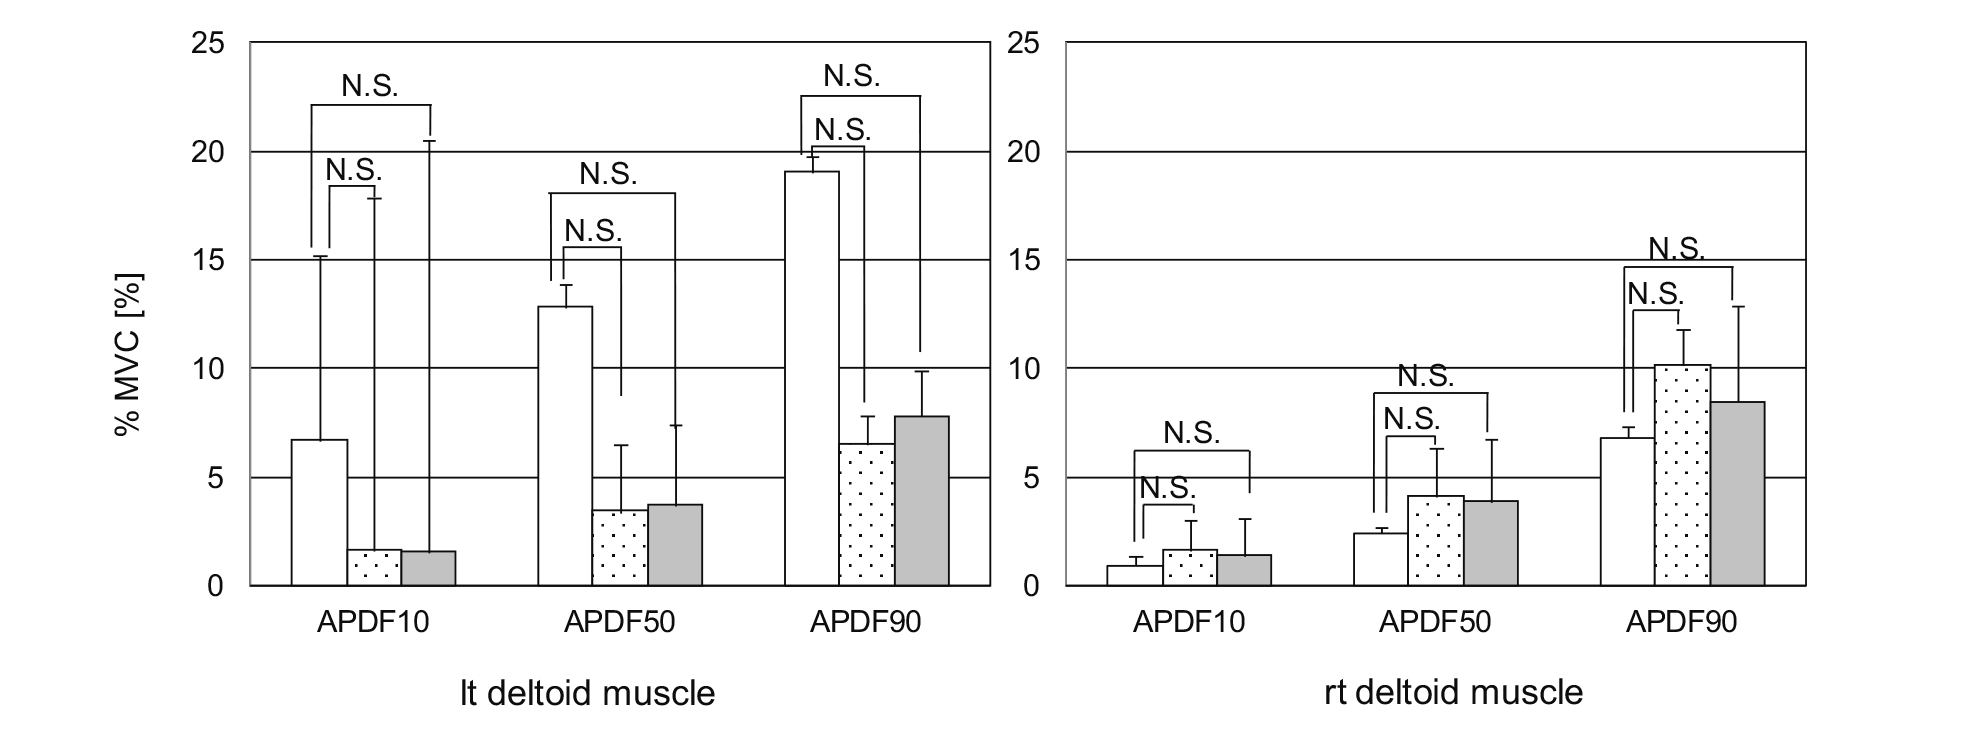
Fig. 4 Summary measurements of shoulder stress for abduction during laparoscopic simulation surgery, represented as the amplitude probability distribution function( APDF) in %MVC. White bar: control group; dotted bar: SAS- group; grey bar: SAS+group; error bar: S. D. No significant differences were found between the SAS- or SAS+ vs. control groups( t-test, Mann-Whitney U test). N. S.: not significant.
